

Energy Management
The primary mission of CMCSS is to educate and empower our nearly 40,000 students to reach their potential. Part of that mission includes fostering a stewardship mindset, instilling attitudes and actions that support environmental sustainability and energy conservation. We believe that energy efficiency and conservation are vitally important for protecting our environment, preserving our natural resources, and encouraging responsible use of our community’s tax dollars. The Energy Management Program is designed to educate everyone about energy efficiency and conservation, and promote energy-efficient habits.
CMCSS operates and maintains 42 school buildings and 12 additional support facilities. Annually, the District consumes approximately 66,000,000 kWh of electricity, 115,000,000 gallons of water & sewer, and 780,000 ccf of natural gas. The cost of these energy and utility purchases exceeds $10,000,000 annually (the equivalent of average annual household utility costs for about 2,700 single-family homes), highlighting the need for continuing to evaluate our current energy management practices across all buildings to ensure that, as the District continues to grow, our building systems remain as efficient as possible.
May 2025 - April 2026 Forecast vs. Actual Utility Costs
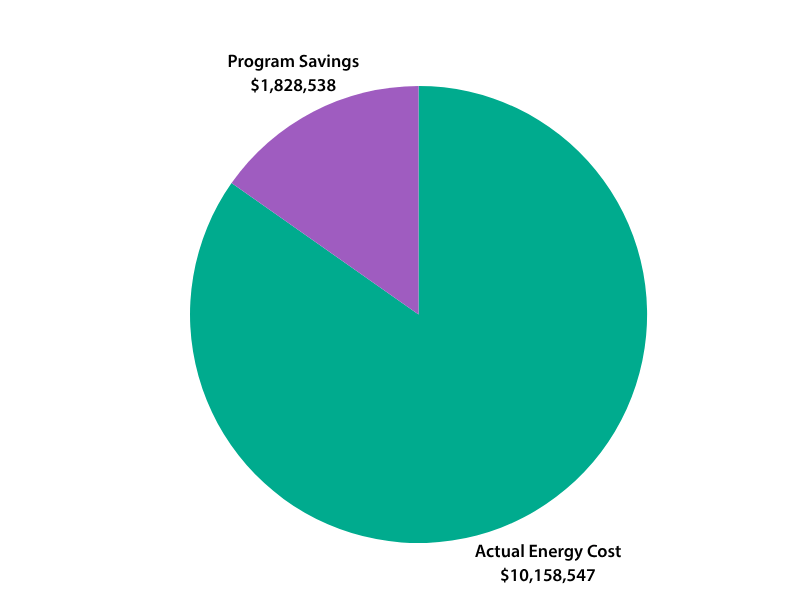
Forecasted Utility Costs
$11,987,085
- Amount CMCSS would have spent on utilities without energy saving initiatives.
- Base year estimate adjusted for prices, load increases, and weather.
Actual Energy Costs
$10,158,547
- Actual energy cost for electricity, water, sewer, and gas resulting from energy saving initiatives.
Program Savings
$1,828,538
- Building temperature controls
- LED Lighting Retrofits
- Equipment Efficiencies
- Utility Monitoring
- Custodial Practices
- Education and Behavior
May 2025 - April 2026 Overall Energy Usage
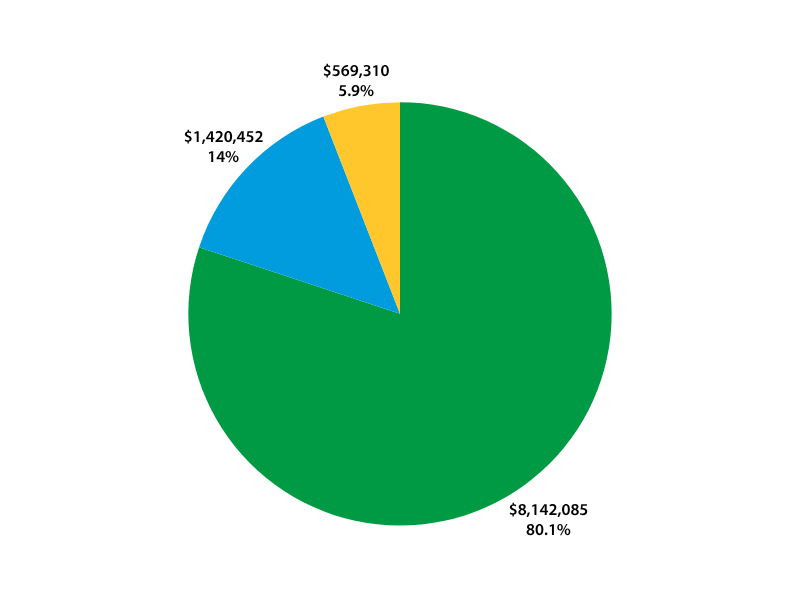
Electricity (Green) – $8,142,085 (80.1%)
Water (Blue) – $1,420,452 (14%)
Natural Gas (Yellow) – $596,310 (5.9%)
Electricity Usage by the District
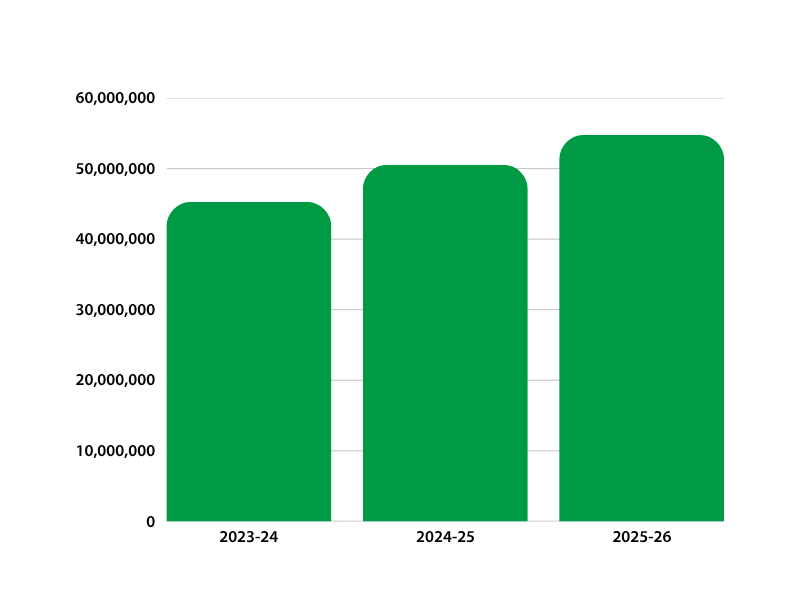
Electricity usage seen in the above bar chart is as follows:
2023-2024 – 45,279,418
2024-2025 – 50,546,728
2025-2026 – 54,767,919
Water Usage by the District
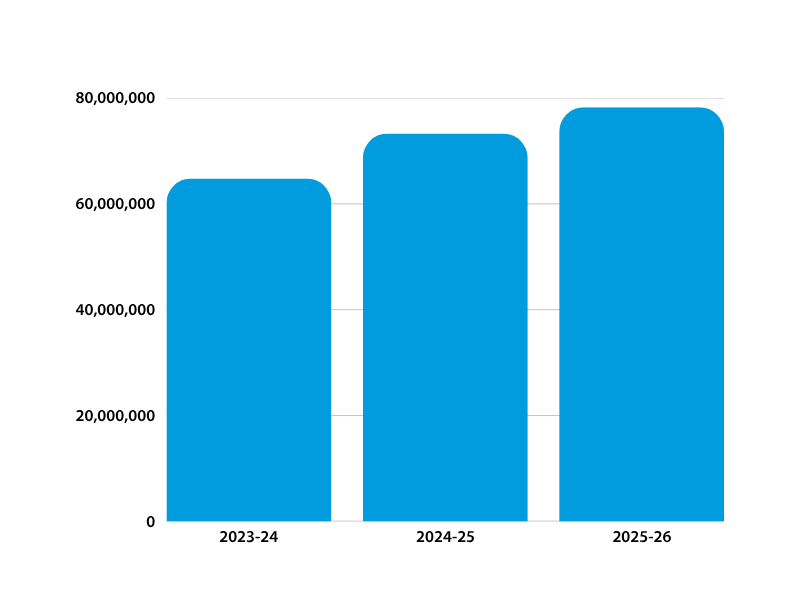
Water usage seen in the above bar chart is as follows:
2023-2024 – 64,816,010
2024-2025 – 73,308,500
2025-2026 – 78,277,200
Natural Gas Usage by the District
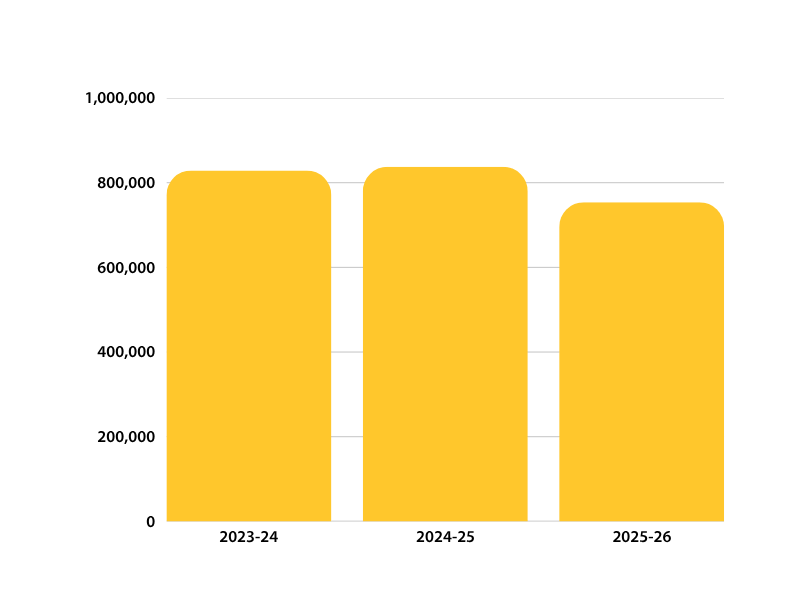
Natural gas usage seen in the above bar chart is as follows:
2023-2024 – 829,020
2024-2025 – 837,922
2025-2026 – 753,969
2024-2025 vs. 2025-2026
Electricity usage (kWh) went up 8.4% or 4,221,191.
Natural gas usage (ccf) went down 10% or -83,953.
Water/Sewer usage (gallons) went up 6.8% or 4,968,700.
For the 2025-26 school year, electricity and water usage saw modest increases compared to the prior year, while natural gas usage decreased significantly by 10%. Analysis of weather-related data for the past three school years revealed a patter of seasonal demand fluctuations that mirrored annual natural gas consumption totals.
LED Savings
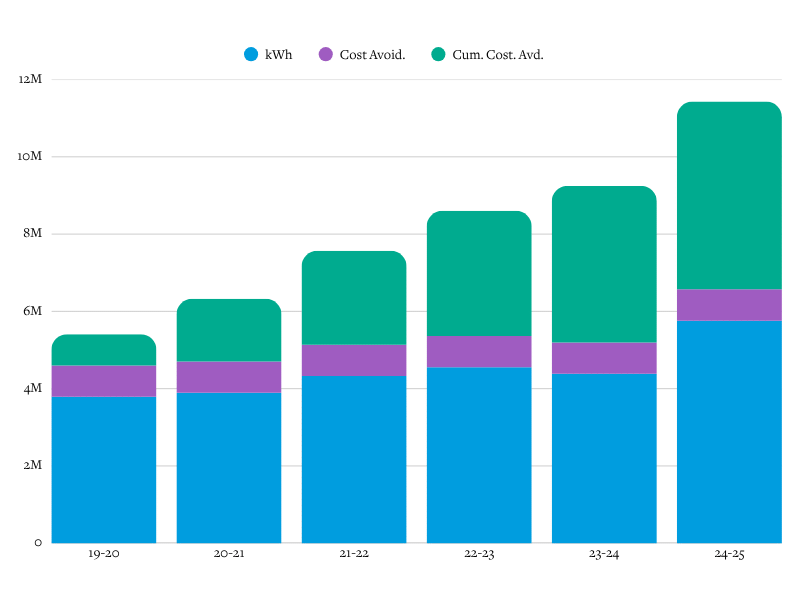
LED savings graph includes:
2019-20 (kWh, Cost Avoid., Cum. Cost Avd)
$3,788,761
$810,107
$810,107
2020-21 (kWh, Cost Avoid., Cum. Cost Avd)
$3,894,193
$810,107
$1,620,214
2021-22 (kWh, Cost Avoid., Cum. Cost Avd)
$4,325,760
$810,107
$2,430,321
2022-23 (kWh, Cost Avoid., Cum. Cost Avd)
$4,553,390
$810,107
$3,240,428
2023-24 (kWh, Cost Avoid., Cum. Cost Avd)
$4,387,305
$810,107
$4,050,535
2024-25 (kWh, Cost Avoid., Cum. Cost Avd)
$5,759,351
$810,107
$4,860,642